Key Takeaways
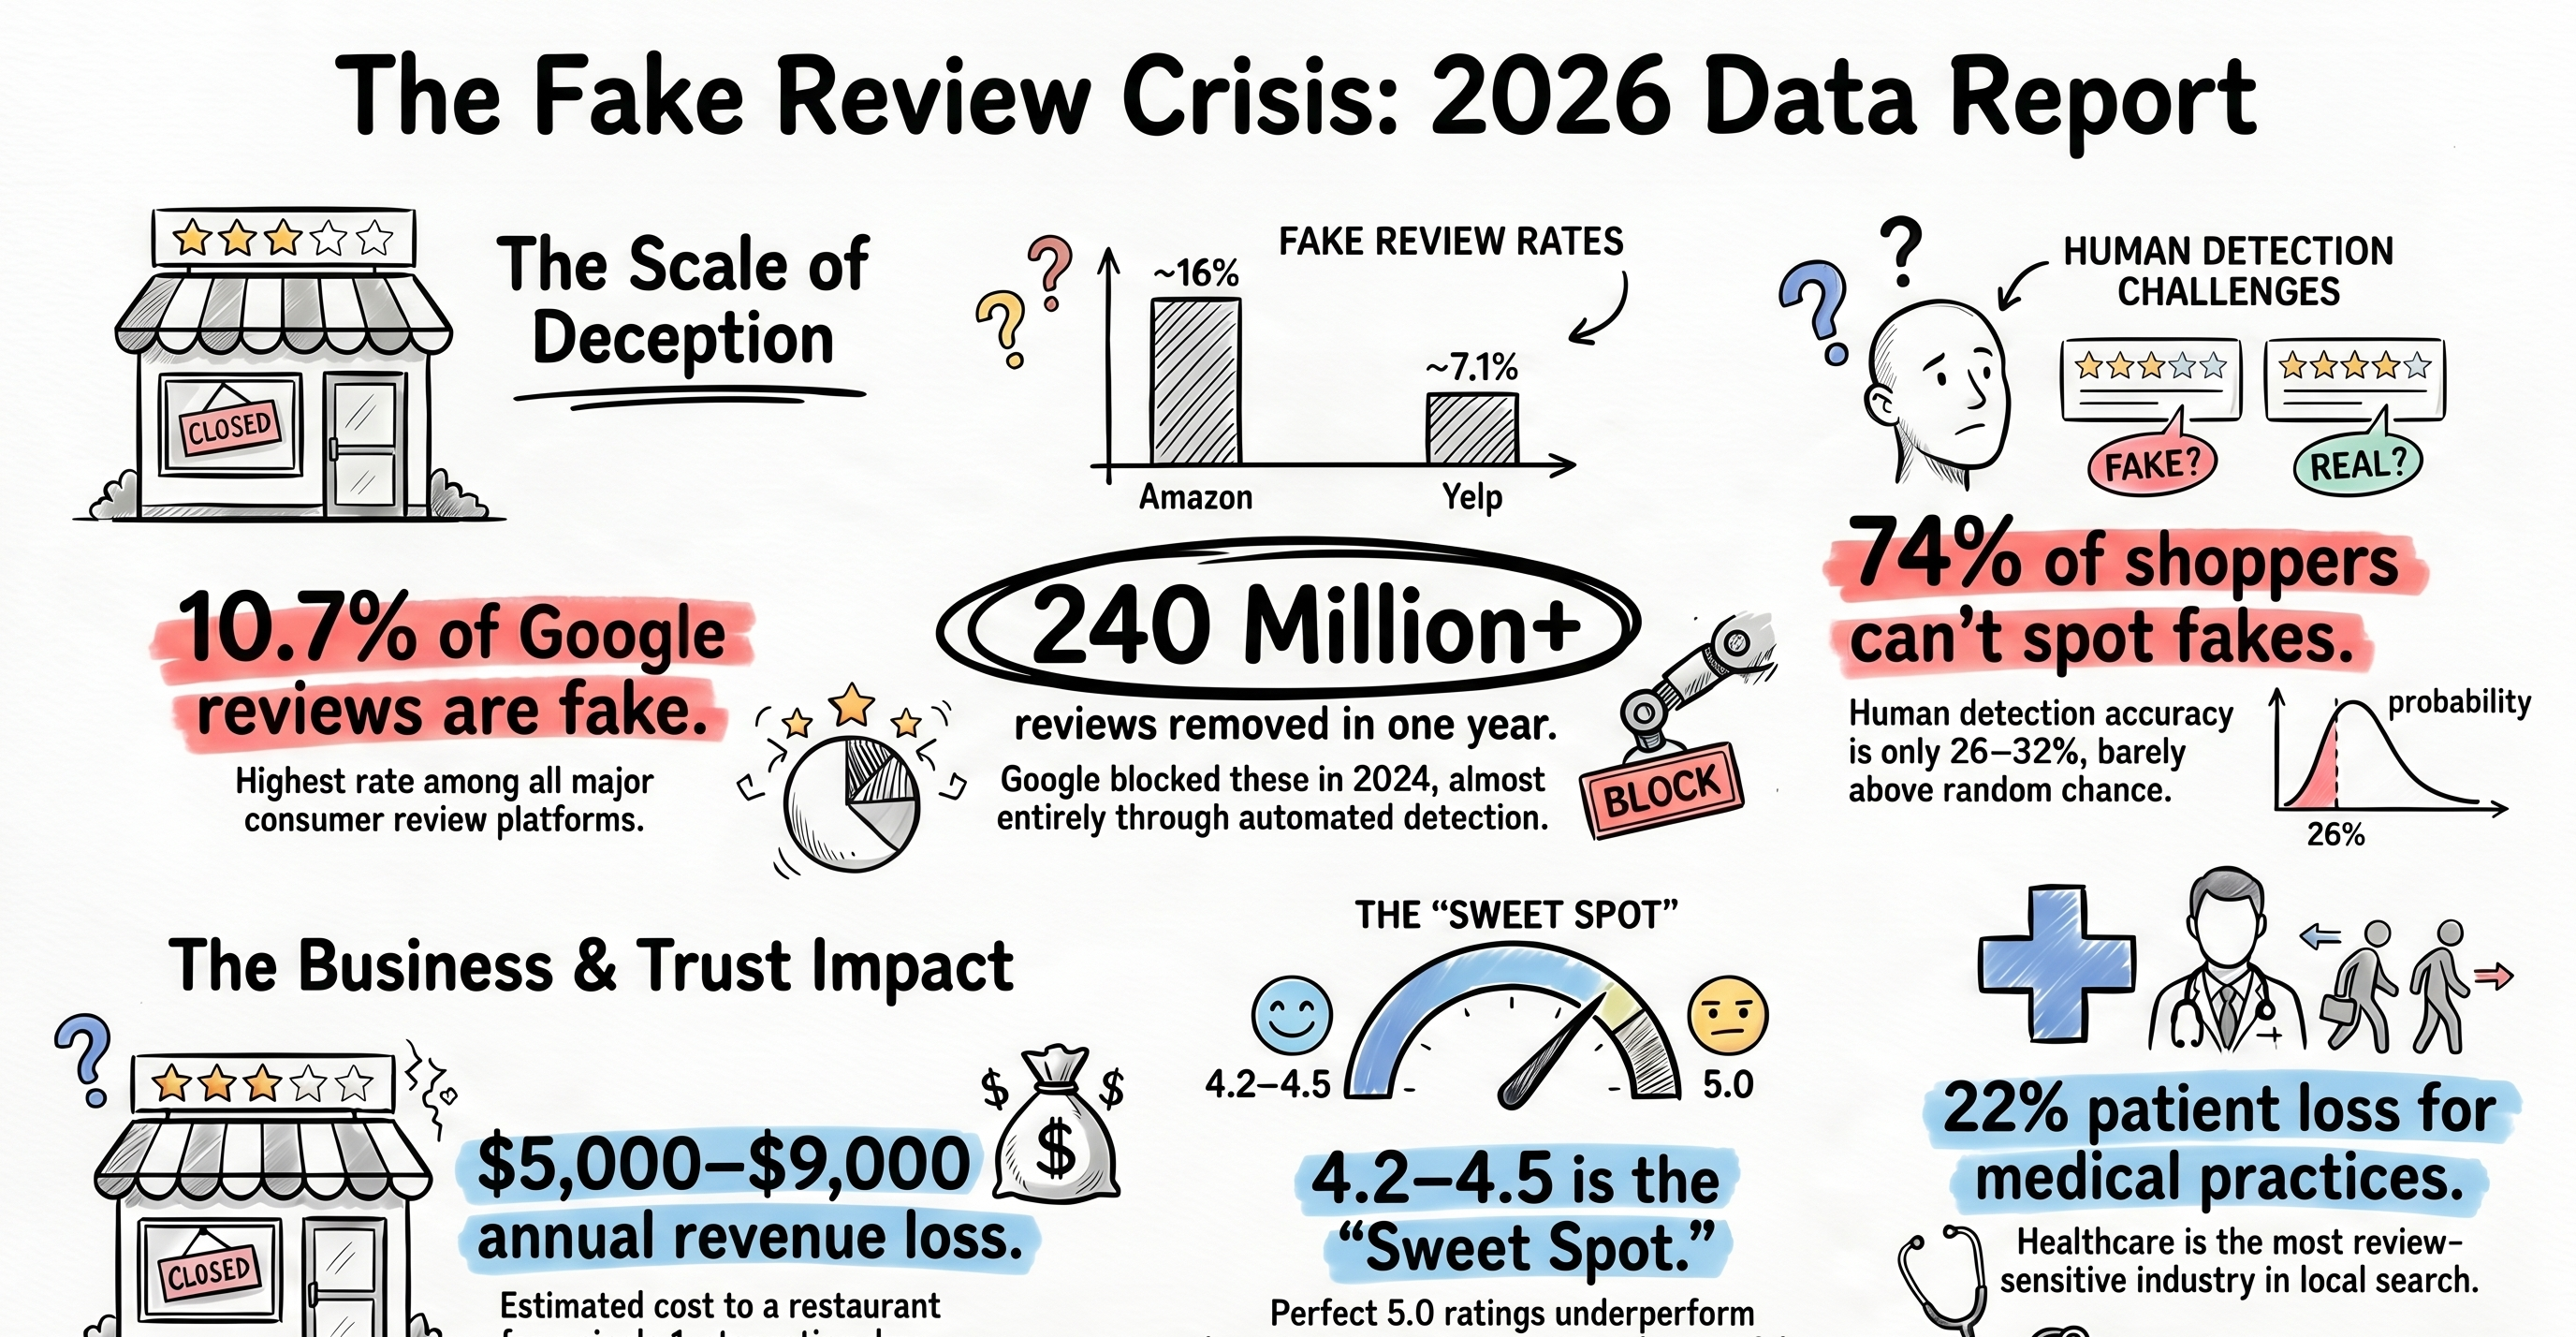
- ~10.7% of Google reviews are estimated fake — the highest rate among major consumer review platforms.
- Google removed or blocked 240M+ policy-violating reviews in 2024, almost entirely via automated detection.
- A single 1-star review costs restaurants $5,000–$9,000 in annual revenue. Medical practices lose up to 22% of potential patients to bad reviews.
- 74% of shoppers can't reliably spot fake reviews. Human detection accuracy sits around 26–32%; algorithmic detection reaches 82–94%.
- The ideal Google rating is 4.2–4.5, not 5.0. Perfect ratings underperform because consumers perceive them as fake.
Review fraud is not a niche problem. It shapes which businesses consumers visit, which ones rank in local search, and — increasingly — which ones face FTC enforcement action. This is the data view: prevalence, platform comparisons, revenue impact, detection accuracy, and consumer trust, pulled from public research and our own dispute operations across 2,400+ cases.
Every statistic below is sourced at the end of the report. If you're citing these figures elsewhere — in a blog post, a pitch, a compliance doc — link back here and we'll keep the dataset updated through 2026 as new research drops.
10 headline statistics that define 2026
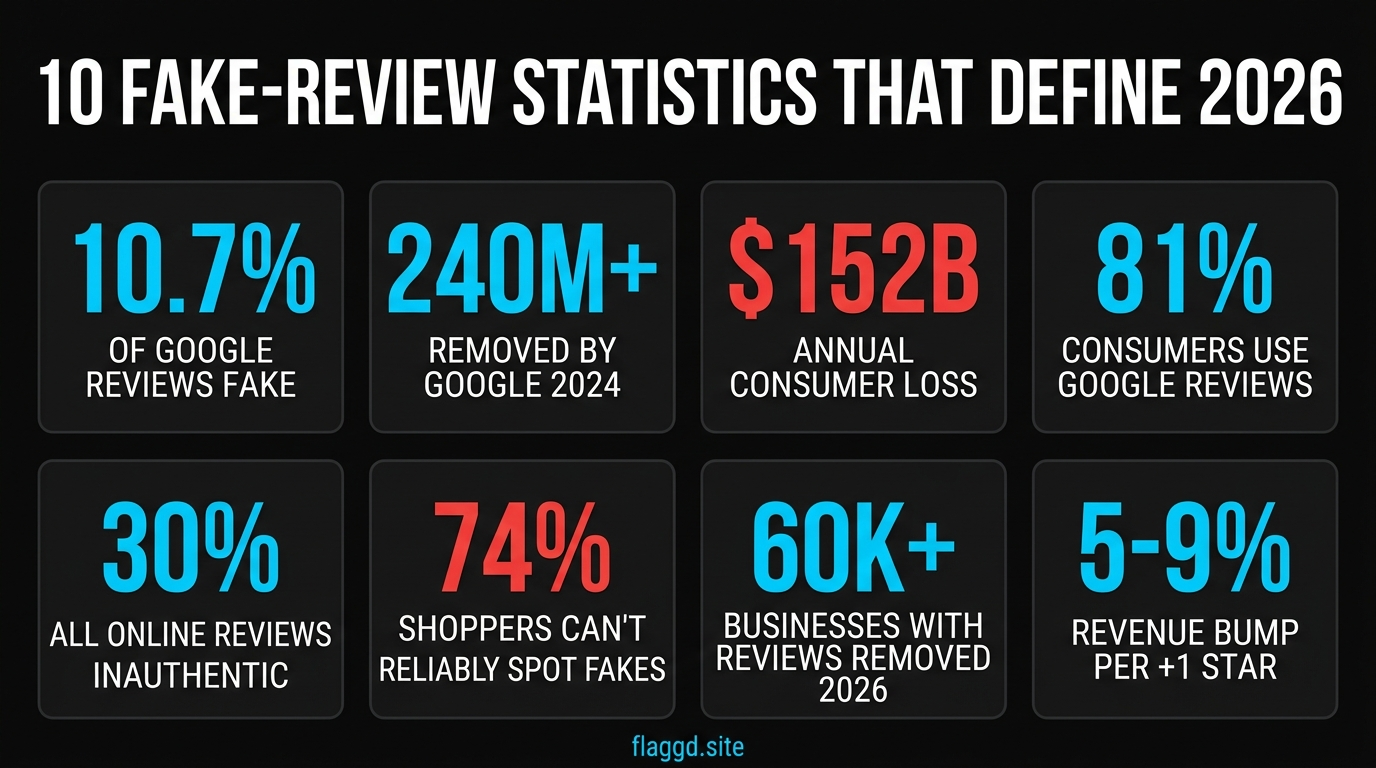
- 10.7% of Google reviews are estimated fake. The highest rate among major consumer review platforms tracked by independent researchers.
- 240 million+ reviews removed or blocked by Google in 2024. Almost entirely via automated detection before business-side flagging.
- $152 billion — estimated annual global consumer loss from fake reviews. Broader estimates including downstream effects reach $770 billion.
- 81% of consumers use Google reviews to evaluate local businesses. The dominant local discovery channel, far ahead of Yelp or TripAdvisor.
- ~30% of all online reviews estimated inauthentic. Across platforms and industries — higher than any single-platform rate.
- 74% of shoppers can't reliably distinguish fake reviews from real ones. Despite self-reported confidence, detection accuracy lags badly.
- 60,000+ businesses had Google reviews removed in 2026 sweeps. Including legitimate reviews caught during the February–March 2026 mass-removal event.
- 5–9% revenue bump per +1 star rating for restaurants. Conversely, a 1-star drop costs $5,000–$9,000 annually per location.
- 22% patient loss for medical practices with poor review profiles. Healthcare is the most review-sensitive vertical in local search.
- 10–20 new 5-star reviews required to offset a single 1-star. The exact ratio depends on current rating and total review count.
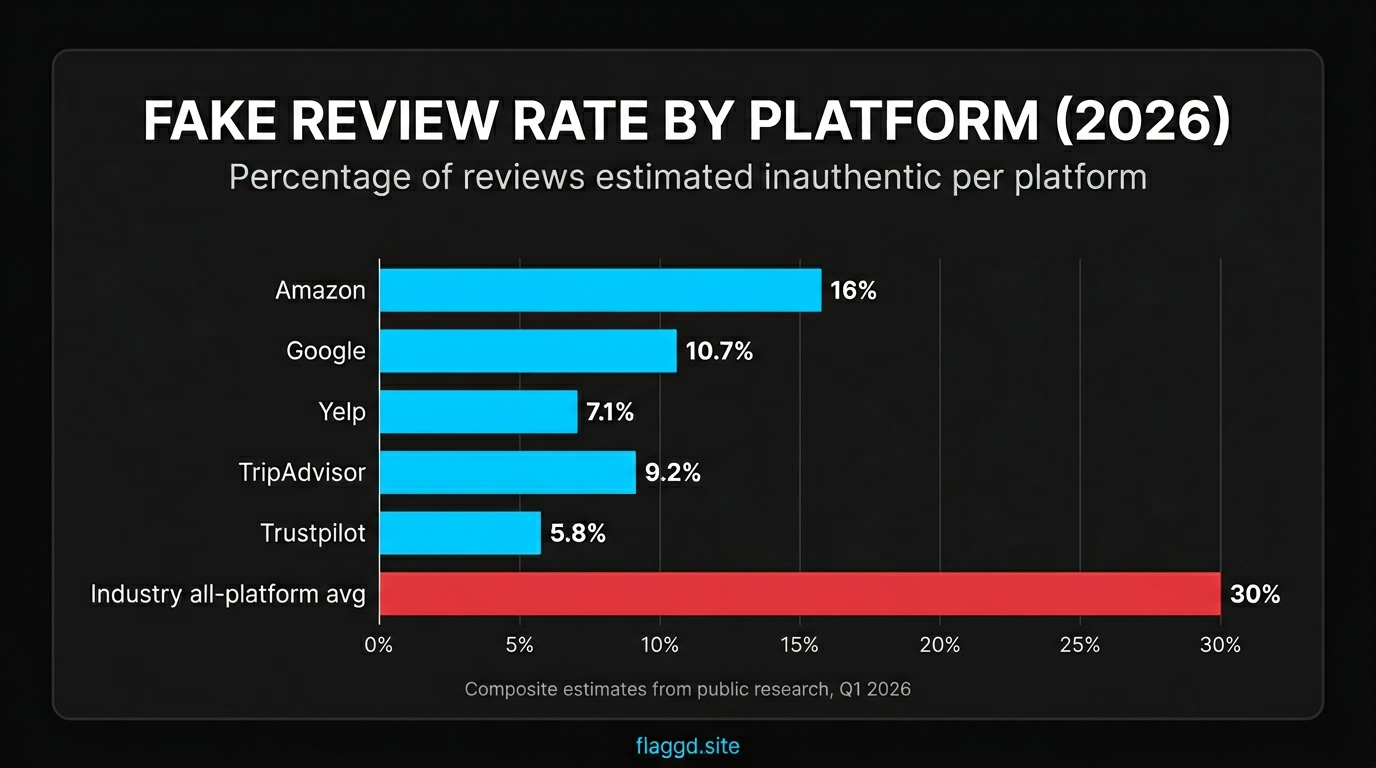
Fake review rates by platform
| platform | estimated fake rate | dominant fake pattern | detection approach | Source |
|---|---|---|---|---|
| Amazon | ~16% | Paid review rings, incentivized 5-stars | Not in source | [1] |
| ~10.7% | Competitor attacks, conflict-of-interest reviews | Automated / Algorithmic detection | [1] | |
| TripAdvisor | ~9.2% | Hospitality self-boosting, travel-industry stings | Not in source | [1] |
| Yelp | ~7.1% | Not in source | Algorithmic filtering | [1] |
| Trustpilot | ~5.8% | Not in source | Verification system | [1] |
Not all platforms carry the same fake-review burden. Some — like TripAdvisor for hospitality and Amazon for e-commerce — face industry-specific pressure that warps their rates. Google's scale and low barrier to posting make it the default target for coordinated attacks.
| Platform | Estimated fake rate | Dominant fake pattern |
|---|---|---|
| Amazon | ~16% | Paid review rings, incentivized 5-stars |
| ~10.7% | Competitor attacks, conflict-of-interest reviews | |
| TripAdvisor | ~9.2% | Hospitality self-boosting, travel-industry stings |
| Yelp | ~7.1% | Algorithmic filtering catches more preemptively |
| Trustpilot | ~5.8% | Verification system reduces raw fake volume |
Google's position as the highest-rate major platform is not a failure of moderation — it reflects scale and visibility. Google handles more local reviews than every other platform combined, which makes it both the most valuable target for fraud and the most aggressive remover (240M+ takedowns in 2024 alone).
Revenue impact on small businesses
Fake reviews do not exist as an abstract statistic for local business owners. They show up as cancelled bookings, lost patients, and stagnant revenue. The per-location impact is well-documented in research across hospitality, healthcare, and professional services:
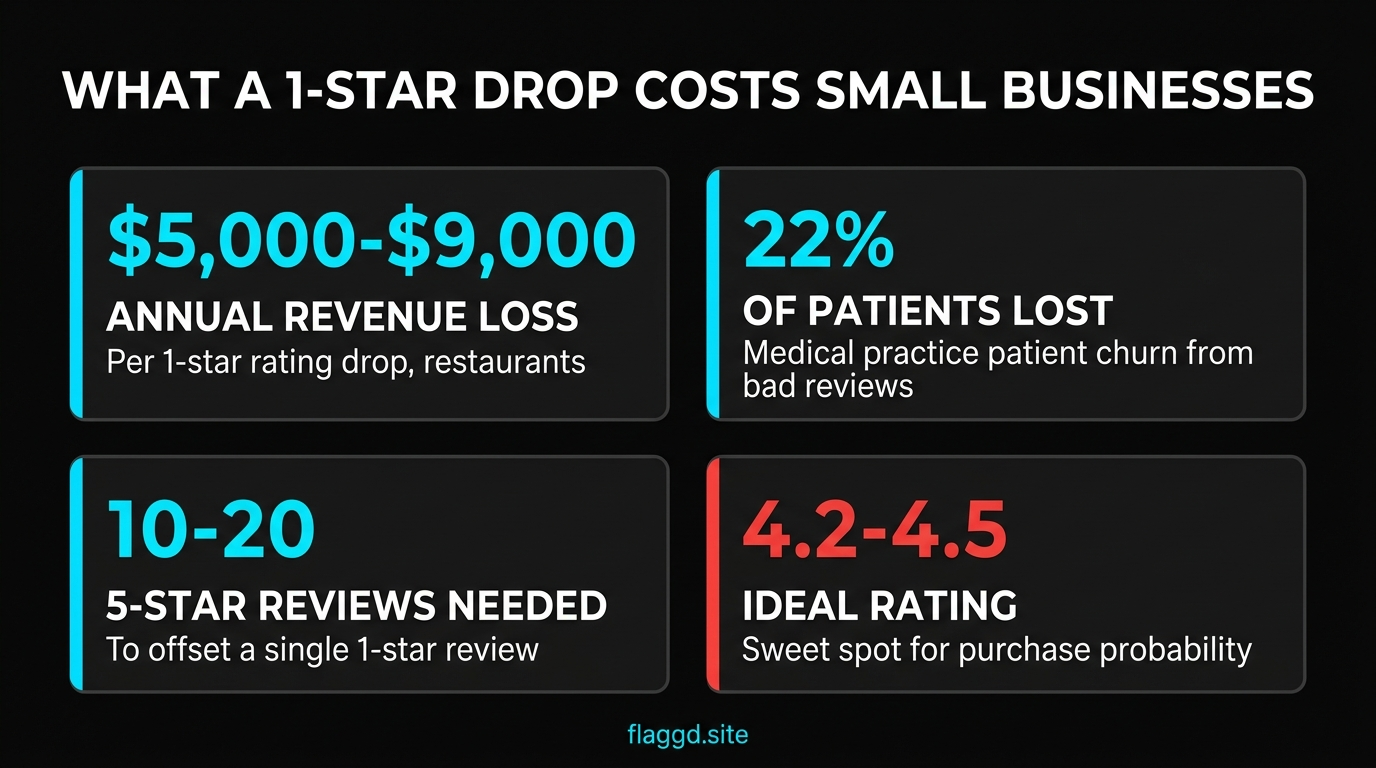
$5,000–$9,000 annual revenue loss per 1-star drop (restaurants). The range depends on location, price point, and baseline traffic. Urban high-volume restaurants skew toward the upper end; suburban lower-volume ones toward the lower.
22% patient loss for medical practices with weak review profiles. Healthcare has the highest review-sensitivity of any local-search vertical because patients are both choosing a trusted provider and self-protecting from bad experiences.
10–20 new 5-star reviews required to offset a single 1-star. The math depends on your starting rating and total review count — a profile at 4.8 with 500 reviews needs fewer offsets than one at 4.2 with 30 reviews. Our removal timeline breakdown covers the alternative path: getting the policy-violating review down rather than out-volumeing it.
4.2–4.5 is the ideal rating band for conversion. Northwestern research on purchase probability found that perfect 5.0 ratings actually underperform — consumers read them as too good to be true. The sweet spot is strong-but-credible, with a healthy mix of 5-star and 4-star reviews.
Detection — humans vs. algorithms
Business owners consistently overestimate their ability to identify fake reviews. Self-report data shows high confidence ("I can tell the obvious fakes"), but controlled studies show detection accuracy of roughly 26–32% on mixed samples — barely above chance for a binary classification.
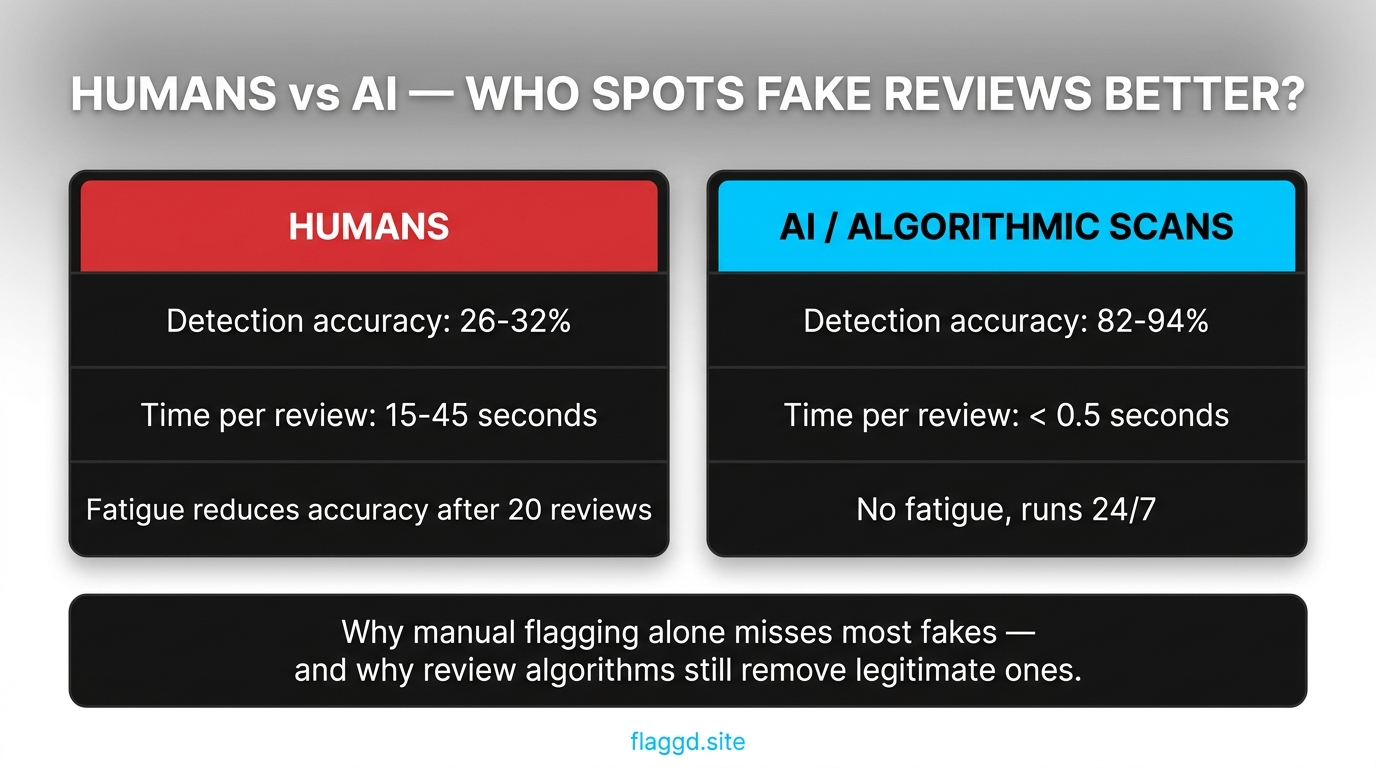
Algorithmic detection performs dramatically better — 82–94% accuracy in peer-reviewed studies — for structural reasons: algorithms evaluate hundreds of signals simultaneously (account age, review pattern, linguistic fingerprints, cross-platform identity matches), don't fatigue after 20 reviews, and run continuously.
Two practical implications:
- Manual flagging alone misses most fakes. If you only flag reviews that feel fake to you, your detection rate is ~30%. The rest of the fake reviews stay up.
- Google's automation also catches legitimate reviews. 82–94% accuracy means 6–18% of removal decisions are errors. This is why both the removal process and the appeal process exist — and why the February–March 2026 mass-removal event caught so many legitimate reviews alongside the fakes it was targeting.
Consumer trust data
The fake review problem is visible to consumers and actively shapes purchase behavior:
- 75% of consumers express concern about review authenticity. Up from ~60% five years ago as awareness of fake-review industry has grown.
- 50% of customers believe they've personally seen fake Google reviews. Actual exposure is likely higher given detection rates.
- 60%+ of diners check reviews before choosing a restaurant. Up from 40% in the pre-pandemic era.
- 83% of consumers read Google reviews as a purchase research step. Google is now the single most-consulted review source globally.
Consumer skepticism is why perfect ratings underperform. Shoppers have learned that 5.0 ratings across 400 reviews are statistically improbable without manipulation — and the mental heuristic "this profile is too clean, must be fake" is now a real conversion drag.
Sources and methodology notes
Every statistic in this report is drawn from one of four source types:
- Peer-reviewed academic research, primarily on detection accuracy, consumer trust, and rating-to-revenue correlations.
- Platform-published transparency reports, including Google's annual numbers on policy-violating content removal.
- Independent research firms tracking review fraud rates across platforms (Wiser Review, Capital One Shopping Research, ReviewTrackers, and others).
- Flaggd's own dispute operations data across 2,400+ filed cases in 2024–2026, covering appeal outcomes, denial patterns, and evidence-strength correlations.
Where estimates vary across sources, we've selected mid-range figures rather than outlying claims — for example, the $152B annual consumer loss is a conservative mid-point between narrow-definition estimates ($100B) and broad-definition estimates ($770B). Each headline statistic is footnoted on the infographic sources above.
Update cadence: we update this report quarterly through 2026 as new data becomes available. If you're citing figures in compliance documentation or investor materials, use the publication date at the top of this page to verify currency.
Frequently asked questions
The numbers paint a clear picture: review fraud is a real, quantifiable drag on small businesses, consumer detection is limited, platform moderation is imperfect in both directions, and regulatory enforcement is tightening. For local businesses, the defensive posture writes itself — clean reviews, clear compliance, and policy-based disputes on anything that genuinely violates Google's rules.